How to Analyze Data for Better Decision-Making
A Comprehensive Guide to Analyzing Data for Informed Decision-Making

Frequently Asked Questions
The key benefits include improved accuracy in decision-making, identification of trends and patterns, enhanced operational efficiency, better understanding of customer behavior, and the ability to anticipate future outcomes.
Software tools can streamline data processing, provide advanced analytical methods, enable complex visualizations, and automate repetitive tasks, leading to more efficient and insightful analyses.
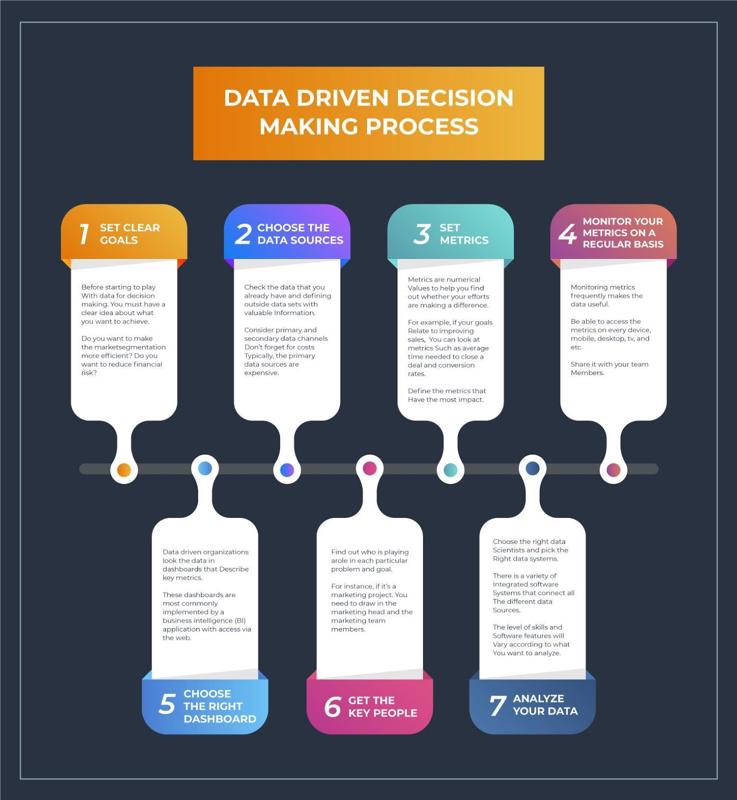
Step by Step Guide
1
Define Your Objectives
Before diving into data analysis, clearly outline what you want to achieve. This will help you focus your analysis on specific goals, such as increasing sales, improving customer satisfaction, or enhancing operational efficiency.
2
Collect Relevant Data
Gather data from various sources that align with your objectives. Sources may include internal databases, surveys, web analytics, social media metrics, or third-party datasets. Ensure the data collected is relevant, accurate, and sufficient for analysis.
3
Clean the Data
Data cleaning is crucial for accurate analysis. Identify and rectify inconsistencies, remove duplicates, and address missing values. This step ensures your analysis is based on reliable data.
4
Select Appropriate Analysis Techniques
Choose the right analytical methods depending on your objectives and data type. Common techniques include descriptive statistics, correlation analysis, regression analysis, and predictive modeling. Familiarize yourself with the fundamentals of these methods.
5
Utilize Software Tools
Leverage software tools that are designed for data analysis, such as Excel, R, Python, Tableau, or Google Analytics. These tools can facilitate complex calculations and visualizations, making patterns in the data easier to identify.
6
Perform Exploratory Data Analysis (EDA)
Conduct exploratory data analysis to understand underlying patterns and distributions in your data. Utilize visualizations like histograms, scatter plots, and box plots to identify trends, outliers, and relationships.
7
Interpret Results
Analyze the findings from your data exploration. Draw conclusions that align with your initial objectives. Consider how the data might inform decisions and identify potential implications for your strategies.
8
Make Data-Driven Decisions
Based on your analysis, determine the best course of action. Use data insights to guide your decision-making process rather than relying solely on intuition or gut feeling.
9
Monitor and Evaluate Outcomes
After implementing decisions based on your data analysis, monitor the outcomes closely. Evaluate whether the expected results align with your objectives and adjust your strategies accordingly.
10
Continuously Improve Your Data Skills
Data analysis is an evolving field. Invest in continuous learning to improve your data analysis skills and stay updated on new tools, techniques, and methodologies to enhance your decision-making process.


